The Clinical and Laboratory Standards Institute (CLSI) has made valuable recommendations for interference testing in document EP07. We created Excel spreadsheets, designed specifically to follow CLSI recommendations and to help simplify the process.
The cells highlighted in yellow are cells that require the input of information and data. The remaining cells are calculations embedded in the worksheet to help with data analysis and interpretation.
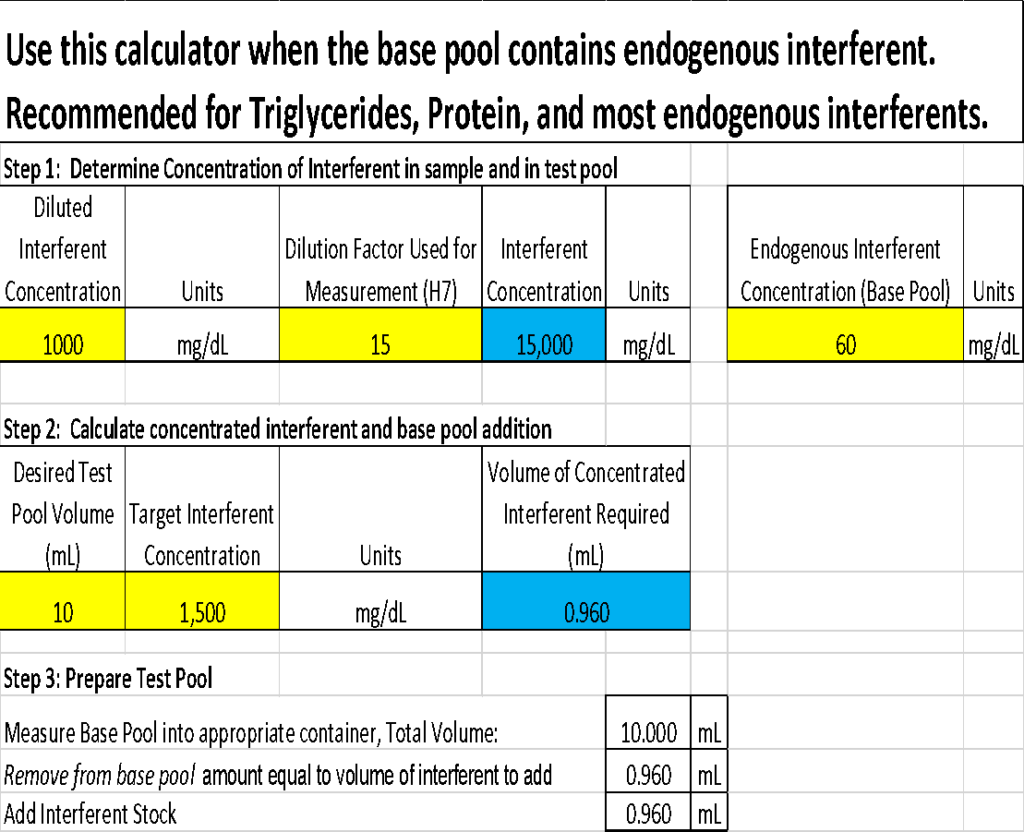
The first worksheet in the workbook is a Test Pool Calculator. Use this sheet to calculate the required concentrations of interferent material to add to create the Test Pools. The section on the right side of the page is useful if the Base Pool contains endogenous interferents such as protein and triglycerides. The worksheet will calculate the amount of additional Interferent to add to reach the target concentration for testing.

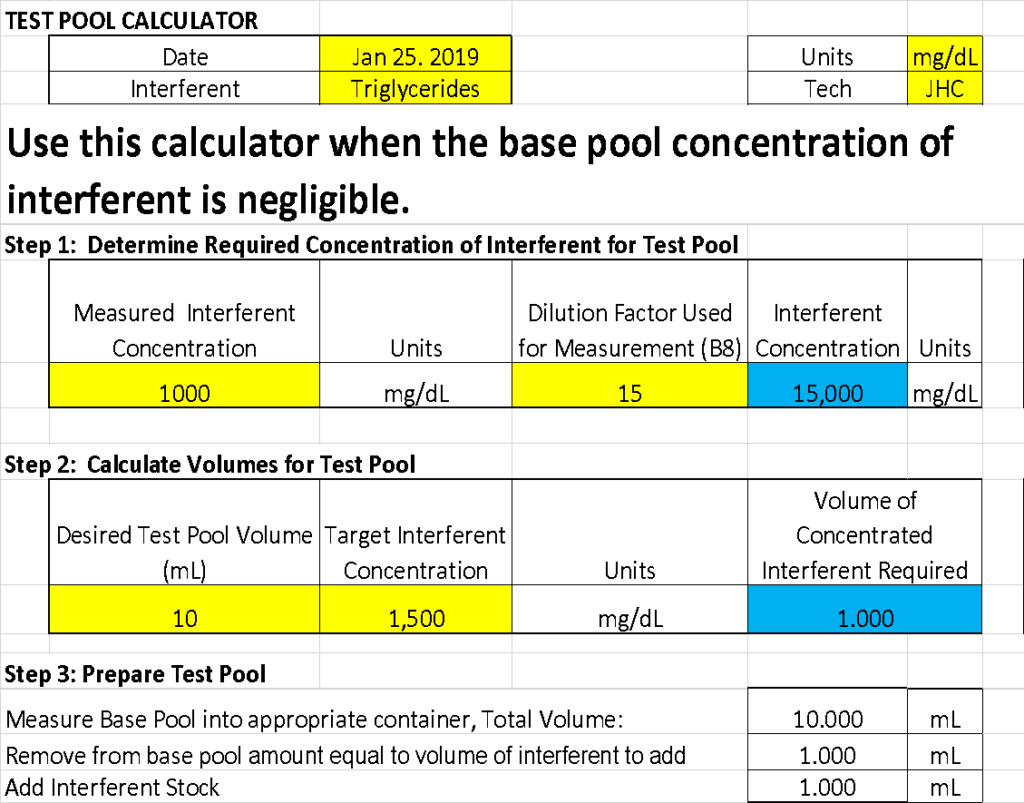
For example, you confirm the triglyceride concentration in the Sun Diagnostics Assurance™ Lipemia Interference Material by diluting 20 µL with 280 µL water (a 15-fold dilution) and the result is 1000 mg/dL. Enter the result (1000 mg/dL) and the dilution factor (15) to determine that the triglyceride concentration in the interference material is 15,000 mg/dL. To create a Test Pool, you will need to add 1 mL of the concentrated interferent material to 9 mL of the Base Pool. This calculation assumes that there is little endogenous triglyceride in the Base Pool.

A better approach is to use the second section of the Test Pool Calculator that considers endogenous concentrations. For example, if the Base Pool contains 60 mg/dL triglycerides you will need to add 0.96 mL of the concentrated Interference material to make a Test Pool with 1500 mg/dL triglycerides.
Of course, you could also just add the endogenous triglyceride concentration to the added triglycerides and set the Test Pool concentration at 1560 mg/dL.

The second worksheet has Replicate Tables to help determine the required number of replicates of Test and Control Pool for the Screening experiments. However, the Interference Screening Study worksheet will also calculate the number of replicates required, if Within-Run Standard Deviation and the maximum allowable difference (Dmax) between Test and Control Pools are defined. If in doubt, we suggest using a two-tailed test with an alpha of 5% (0.05) and a beta of 0.1 (10%).

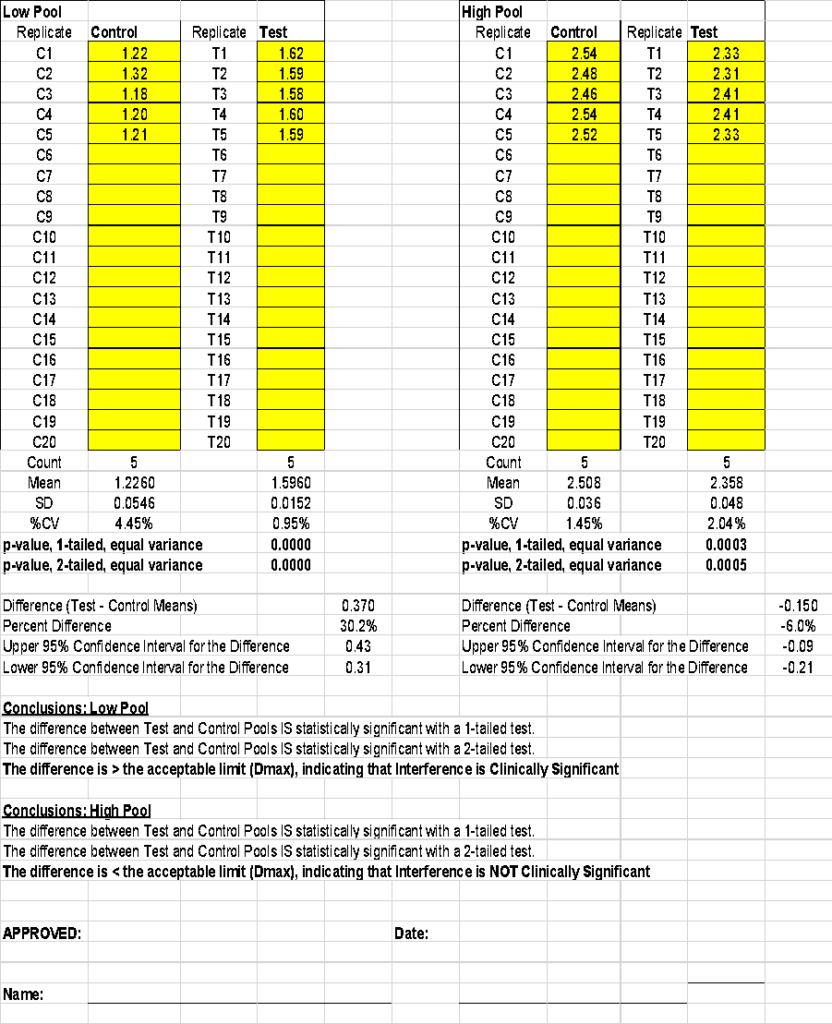
For the Screening Experiment worksheets, enter the measurand test results for Control and Test Pools, and the spreadsheet will calculate the difference, percent difference, upper and lower 95% confidence intervals for the difference, and p-values for a two-sample t-test with equal variances. The t-test and 95% confidence intervals are provided for information purposes only; CLSI recommends interpreting the difference only in terms of clinical significance—defined as a difference greater than the Dmax. The Worksheet includes a signature line and can be printed out to provide a summary of the experiments.
The Workbook also includes worksheets for dose-response experiments. Enter the Interferent concentrations of Levels 1 and 5 and the intermediate concentrations will be calculated. Enter the measurand test results and the means, difference, and percent difference will be calculated, in comparison to Interferent level 1.
The worksheet will also plot analyte concentration (Y) versus interference concentration (X) and calculate slope, intercept, and whether the slope is significantly different from zero. A slope of zero indicates that there is no association between analyte concentration and interferent concentration. This statistical test is provided for informational purposes only as CLSI recommends an interpretation based on the clinical difference (Dmax) only.

The worksheet will also interpret concentration differences and/or percent differences depending on whether Dmax is defined as an absolute concentration or a percent difference. If Dmax is defined as both an absolute difference and percent difference the interpretation of clinical significance will require both to be greater than Dmax.
Finally, the worksheet will interpolate between each level of interferent to calculate the exact interferent concentration that is > Dmax. The spreadsheet may provide multiple concentrations, but the correct interference limit is the one that corresponds to the lowest interferent level that exceeds Dmax.
The Dose-Response worksheet also includes a signature line and can be printed out as a summary report.
Please consider this Workbook as a work in progress. Feel free to review and edit and provide feedback so that we can continue to improve and make interference testing easier. You can download a protected or unprotected copy of the Excel Workbook under Data Analysis Tools from our website: sundiagnostics.us/int-01-routine-interferents. Use the unprotected version to edit the programming, and please email me with any suggested improvements.

